
When we started sketching Plasma, we wanted observability that felt as light as the rest of the platform. The typical approach piles dashboards on top of detached logs and metrics, which drags teams back into context switching. Plasma Observability stitches those data streams together so you can pivot between them without ever losing the story.
Single timeline, layered signals
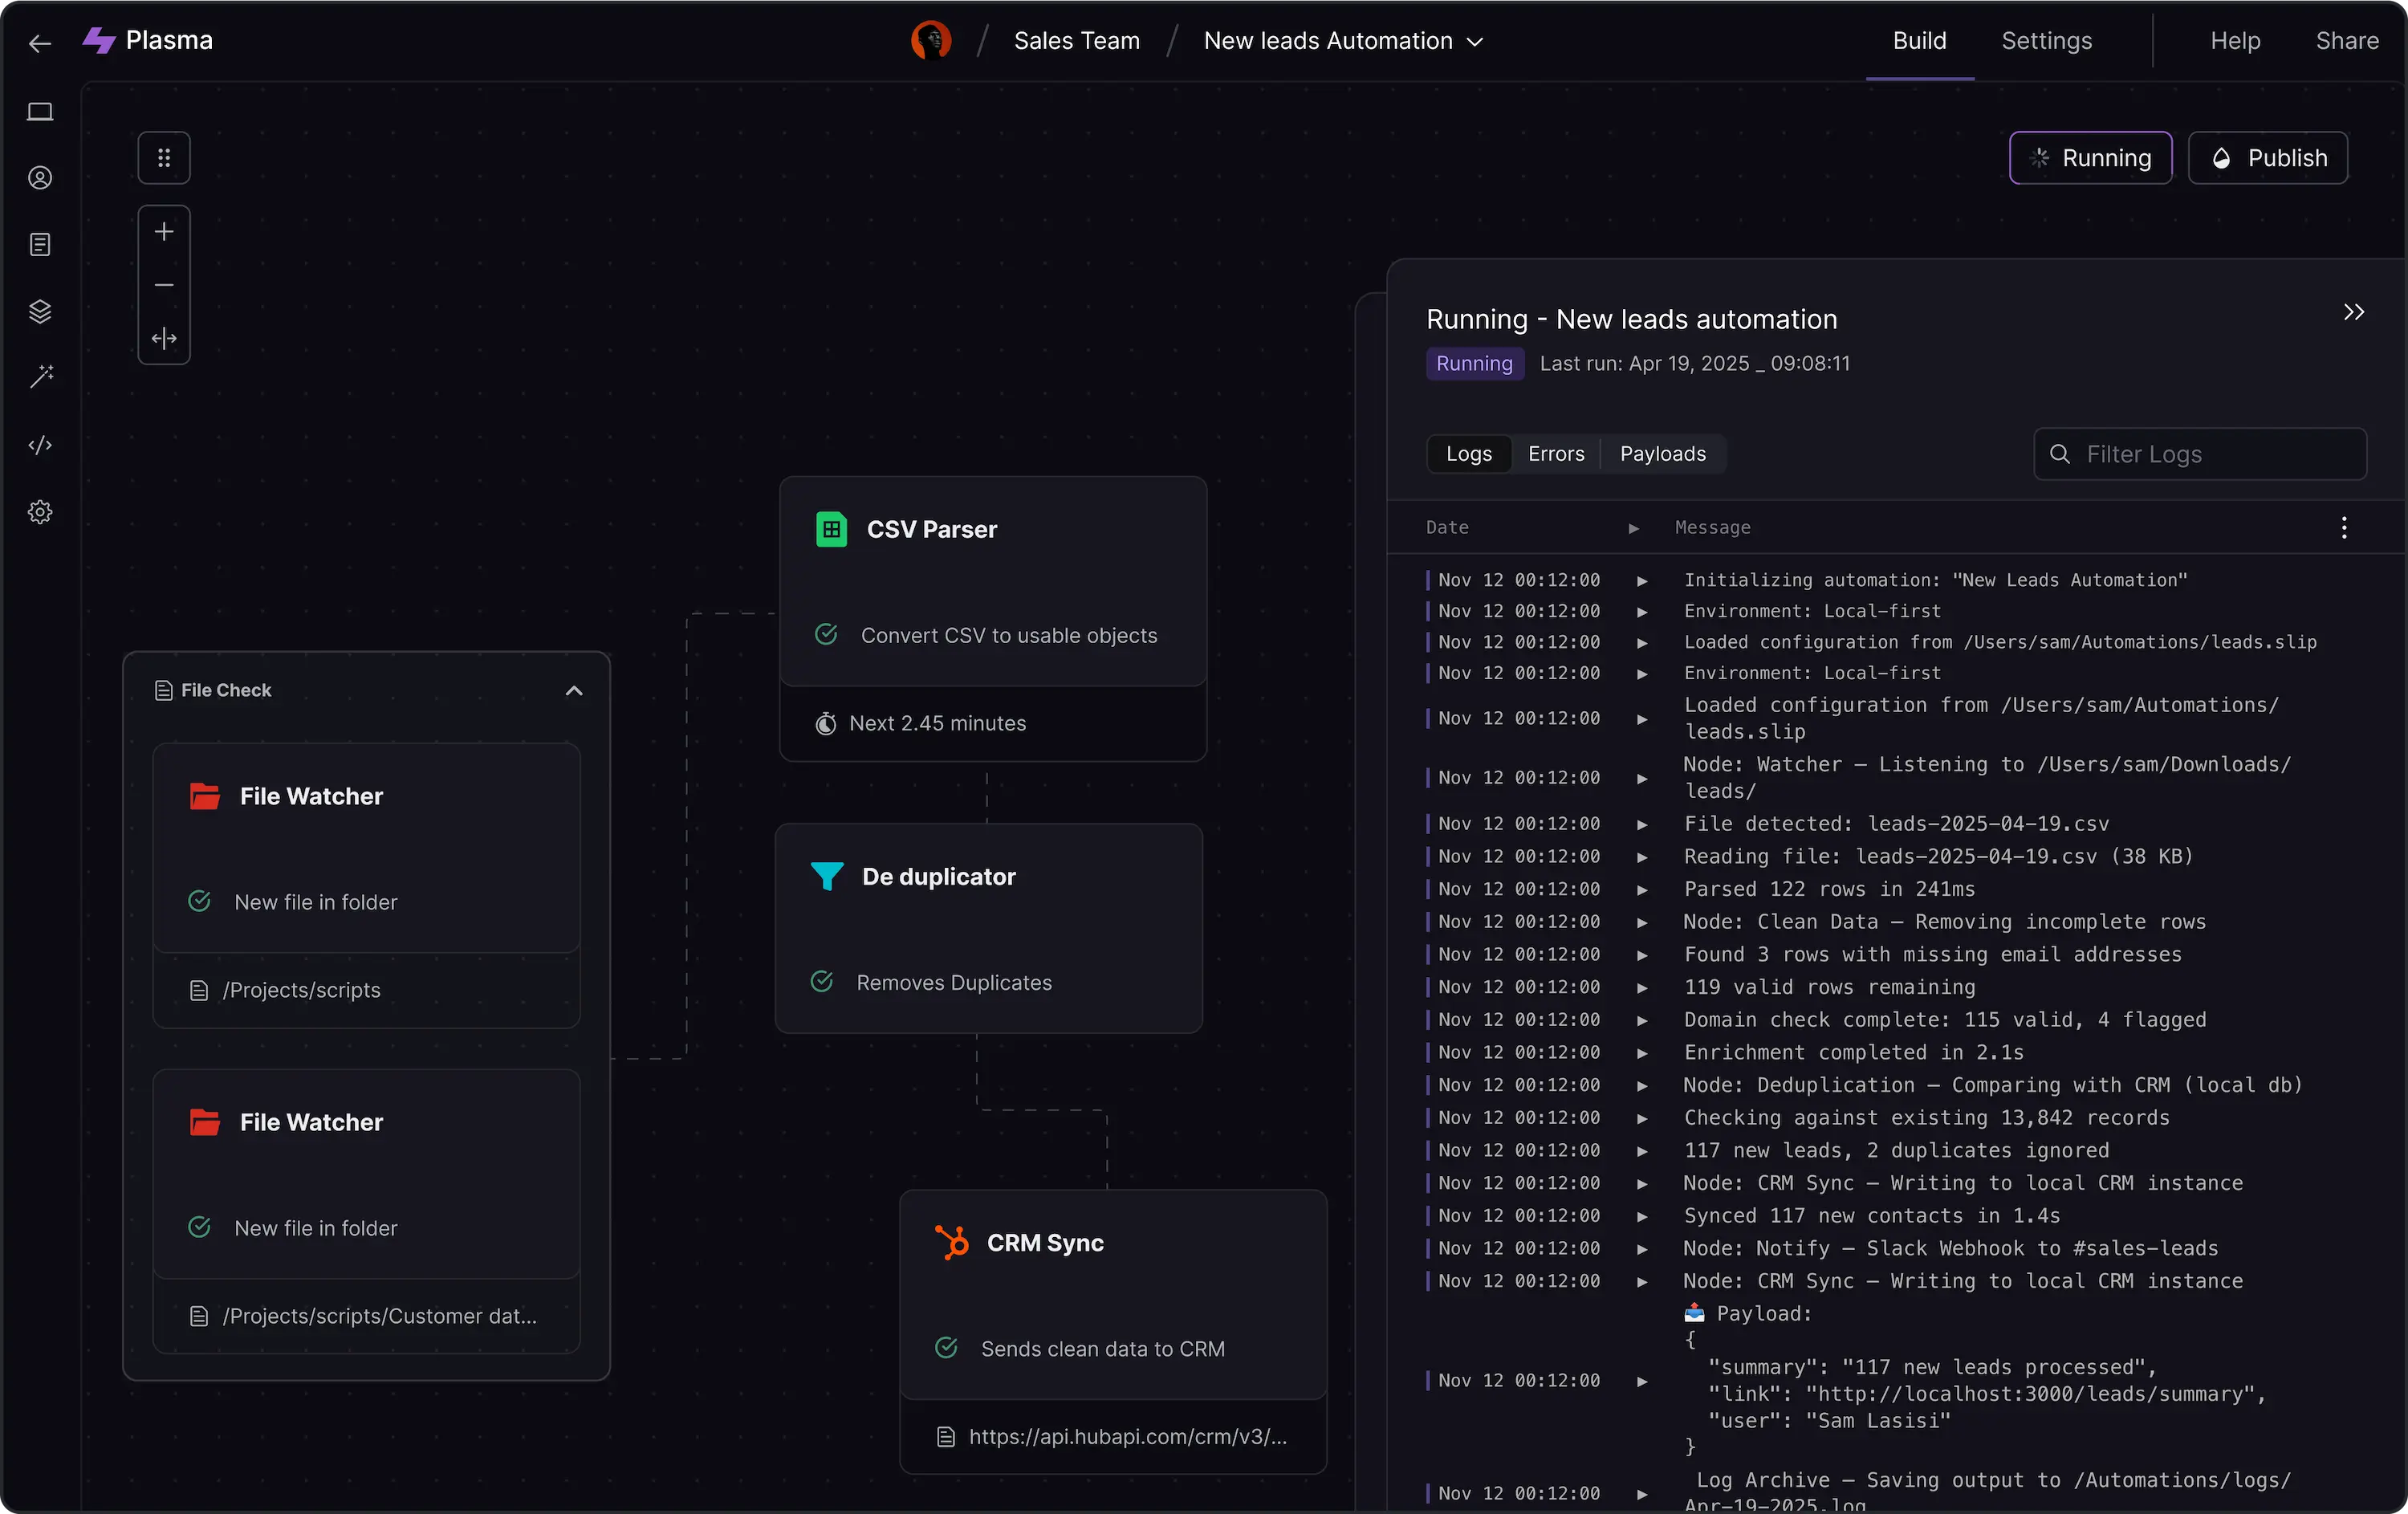
Every event funnels into one timeline that carries logs, traces, and domain events in parallel lanes. Think of it as a studio lightboard: one thin surface, multiple layers, full clarity. Users can pull any lane forward, scrub previews, or freeze a signal and annotate it for the rest of the team.
- Ultra-thin renderers keep interaction latency under 30ms.
- Context cards hydrate with AI-generated summaries that are scoped to the artefacts you are hovering.
- Incident rooms inherit the same timeline, so the context just follows the conversation.
Auto-instrumentation without the sludge
We auto-detect the runtime, propose a starter template, and let you confirm before anything ships. Plasma deploys lean hooks that report only the data you need to triage, and nothing noisy slips through. You can always expand coverage from the control plane, but the default is calm.
Plasma keeps the UI almost weightless by leaning on streaming updates and gentle micro-interactions. The surface stays bright even when you are paging through the deepest log sets.
What’s next
We are rolling out composable alert recipes next. They let you pair a trigger with an AI post-mortem draft so teams feel guided instead of overwhelmed.
If you want early access, follow the changelog or drop us a line—feedback shapes the roadmap.